
43617.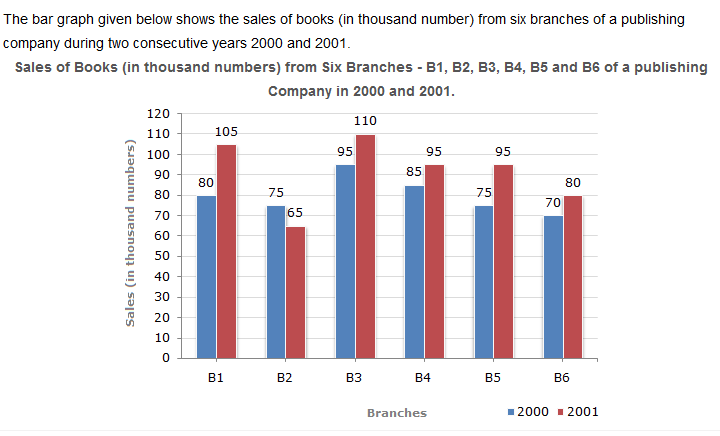
What is the ratio of the total sales of branch B2 for both years to the total sales of branch B4 for both years?
What is the ratio of the total sales of branch B2 for both years to the total sales of branch B4 for both years?
2:3
3:5
4:5
7:9
43618.Total sales of branch B6 for both the years is what percent of the total sales of branches B3 for both the years?
68.54%
71.11%
73.17%
75.55%
43619.What percent of the average sales of branches B1, B2 and B3 in 2001 is the average sales of branches B1, B3 and B6 in 2000?
75%
77.5%
82.5%
87.5%
43620.What is the average sales of all the branches (in thousand numbers) for the year 2000?
73
80
83
88
43621.Total sales of branches B1, B3 and B5 together for both the years (in thousand numbers) is?
250
310
435
560
43622.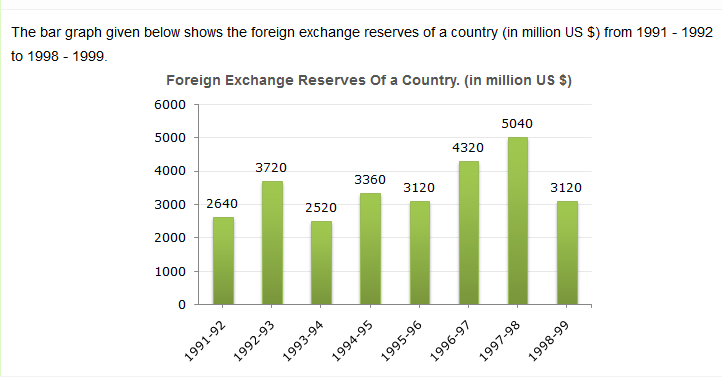
The ratio of the number of years, in which the foreign exchange reserves are above the average reserves, to those in which the reserves are below the average reserves is?
The ratio of the number of years, in which the foreign exchange reserves are above the average reserves, to those in which the reserves are below the average reserves is?
2:6
3:4
3:5
4:4
43624.For which year, the percent increase of foreign exchange reserves over the previous year, is the highest?
1992-93
1993-94
1994-95
1996-97
43625.The foreign exchange reserves in 1996-97 were approximately what percent of the average foreign exchange reserves over the period under review?
95%
110%
115%
125%
43626.What was the percentage increase in the foreign exchange reserves in 1997-98 over 1993-94?
100
150
200
620
43627.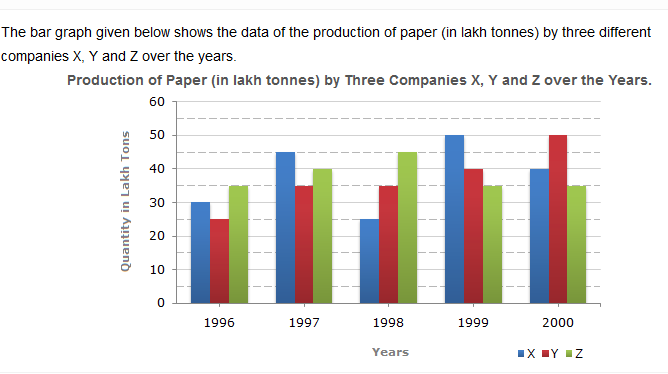
For which of the following years, the percentage rise/fall in production from the previous year is the maximum for Company Y?
For which of the following years, the percentage rise/fall in production from the previous year is the maximum for Company Y?
1997
1998
1999
2000
43628.What is the ratio of the average production of Company X in the period 1998-2000 to the average production of Company Y in the same period?
1:1
15:17
23:25
27:29
43630.In which year was the percentage of production of Company Z to the production of Company Y the maximum?
1996
1997
1998
1999
43631.What is the percentage increase in the production of Company Y from 1996 to 1999?
30%
45%
50%
60%
43632.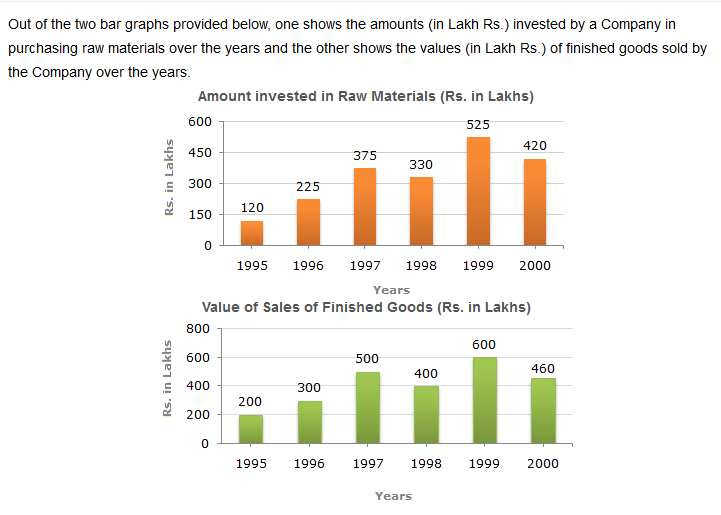
The maximum difference between the amount invested in Raw materials and value of sales of finished goods was during the year?
The maximum difference between the amount invested in Raw materials and value of sales of finished goods was during the year?
1995
1996
1997
1998
43633.The value of sales of finished goods in 1999 was approximately what percent of the sum of amount invested in Raw materials in the years 1997, 1998 and 1999?
33%
37%
45%
49%
43634.What was the difference between the average amount invested in Raw materials during the given period and the average value of sales of finished goods during this period?
Rs. 62.5 lakhs
Rs. 68.5 lakhs
Rs. 71.5 lakhs
Rs. 77.5 lakhs
43635.In which year, the percentage change (compared to the previous year) in the investment on Raw materials is same as that in the value of sales of finished goods?
1996
1997
1998
1999
43636.In which year, there has been a maximum percentage increase in the amount invested in Raw materials as compared to the previous year?
1996
1997
1998
1999