43657.
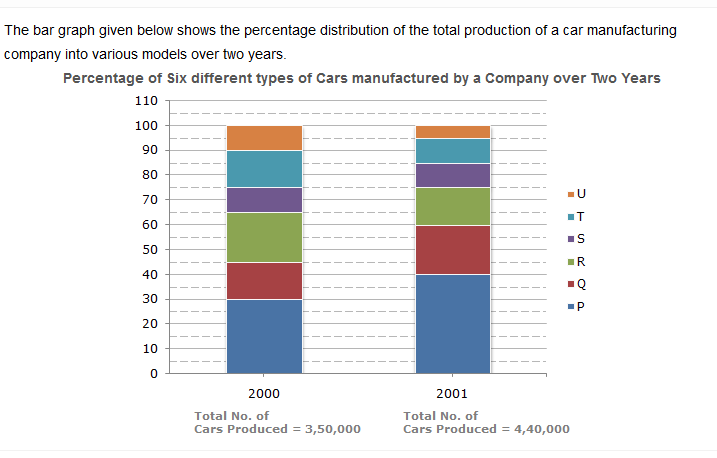
What was the difference in the number of Q type cars produced in 2000 and that produced in 2001?

What was the difference in the number of Q type cars produced in 2000 and that produced in 2001?
35,500
27,000
22,500
17,500
43658.Total number of cars of models P, Q and T manufactured in 2000 is?
2,45,000
2,27,500
2,10,000
1,92,500
43659.If the percentage production of P type cars in 2001 was the same as that in 2000, then the number of P type cars produced in 2001 would have been?
1,40,000
1,32,000
1,17,000
1,05,000
43660.If 85% of the S type cars produced in each year were sold by the company, how many S type cars remain unsold?
7650
9350
11,850
12,250
43662.
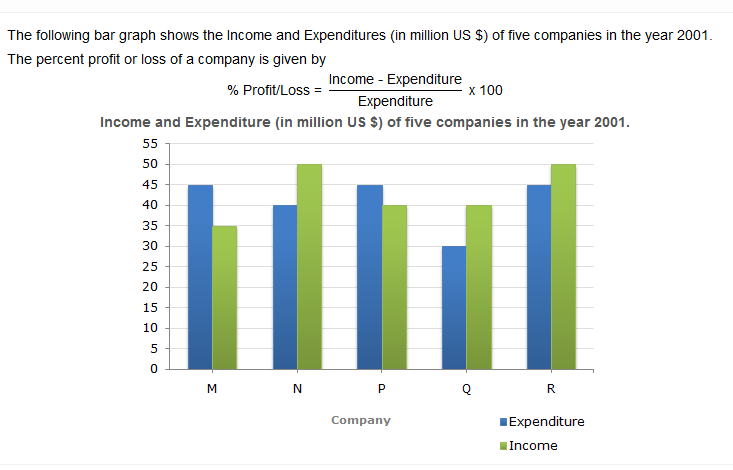
The companies M and N together had a percentage of profit/loss of?

The companies M and N together had a percentage of profit/loss of?
12% loss
10% loss
10% profit
There was no loss or profit
43663.In 2001, what was the approximate percentage of profit/loss of all the five Companies taken together?
5% profit
6.5% profit
4% loss
7% loss
43665.For Company R, if the expenditure had increased by 20% in year 2001 from year 2000 and the company had earned profit of 10% in 2000, what was the Companys income in 2000 (in million US $)?
35.75
37.25
38.5
41.25
43666.If the income of Company Q in 2001 was 10% more than its income in 2000 and the Company had earned a profit of 20% in 2000, then its expenditure in 2000 (in million US $) was?
28.28
30.30
32.32
34.34
- Logical Sequence Test 1
- Line Graph Test 5
- Pie Chart Test 1
- Pie Chart Test 2
- Pie Chart Test 3
- Pie Chart Test 4
- Pie Chart Test 5
- Calendar Test 1
- Calendar Test 2
- Calendar Test 3
- Clock Test 1
- Clock Test 2
- Line Graph Test 4
- Logical Sequence Test 2
- Logical Sequence Test 3
- Logical Sequence Test 4
- Logical Sequence Test 5
- Syllogism Test 1
- Syllogism Test 2
- Blood Relation Test 1
- Blood Relation Test 2
- Blood Relation Test 3
- Number and Letter Series Test 1
- Number and Letter Series Test 2
- Bar Graph Test 2
- table Test 2
- table Test 3
- table Test 4
- table Test 5
- table Test 6
- table Test 7
- table Test 8
- table Test 9
- table Test 10
- table Test 11
- Bar Graph Test 1
- table Test 1
- Bar Graph Test 3
- Bar Graph Test 4
- Bar Graph Test 5
- Bar Graph Test 6
- Bar Graph Test 7
- Bar Graph Test 8
- Bar Graph Test 9
- Line Graph Test 1
- Line Graph Test 2
- Line Graph Test 3
